
THE BIG SHORT IS THE WRONG SCRIPT
Why Michael Burry's dot-com comparison collapses under the weight of five distinct bodies of evidence

Michael Burry earned permanent credibility in the annals of financial history by being right when the entire Wall Street establishment was wrong. Investors listen to him for good reason.
The Cassandra who called the subprime collapse before it became obvious deserves a hearing whenever he raises an alarm.
Burry’s latest warning is specific and unambiguous: in his view, the current AI-driven technology frenzy bears dangerous echoes of the final euphoric months of 1999.

The Nasdaq 100 trading at 43 times forward earnings, with the sector’s top performers averaging annual returns of 784%, looks to him like the last few minutes of a high-speed rally before the inevitable reversal.
The argument is compelling on the surface. Beneath it, five distinct bodies of evidence suggest a more nuanced picture.
THE FRAMEWORK BURRY IS APPLYING TO 2026 WAS DESIGNED FOR 1999. IT DOES NOT FIT THE DATA.
The argument deserves to be dismantled with precision, one layer at a time.
I. THE WRONG METRIC: RETURNS ARE NOT MULTIPLES
Burry’s most striking data point is the comparison of trailing returns.
The average return of the Nasdaq 100’s top-ten performers over the past year stands at 784%, a figure that now exceeds the 622% average recorded in the twelve months preceding the March 2000 peak.
The implication is clear: the magnitude of the move signals irrational excess.
The problem with this argument is that return figures tell you nothing about whether multiples are expanding or compressing.
Prices can rise 3,000% and the stock can simultaneously become cheaper, provided earnings estimates rise faster than price. That is exactly what is happening.
Examine the chart below comparing price (top part) and 12-month forward P/E (lower part).
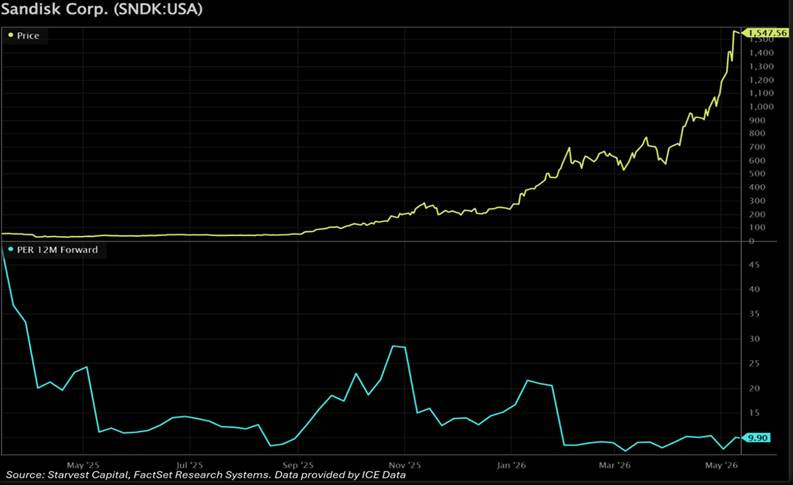
SanDisk Corporation’s share price has surged from around $50 to $1,562, a more than thirty-fold appreciation in roughly fourteen months.
By any surface reading, that looks like the anatomy of a speculative blow-off.
Yet the 12-month forward price-to-earnings ratio has done the precise opposite: it has compressed from 45 times earnings to under 10 times over the same period.
THIS IS THE MATHEMATICAL SIGNATURE OF EARNINGS GROWTH RUNNING AHEAD OF PRICE.
It is the inverse of bubble mechanics.
Bubbles are defined by multiple expansion: investors paying ever-higher prices for each unit of earnings or, more commonly in true manias, for earnings that are purely hypothetical.
What the SanDisk chart documents is a company whose earnings forecasts have risen so violently that even a thirty-fold price increase leaves the stock trading at a fraction of its former multiple.
The second chart makes the mechanism explicit.
Analyst consensus for SanDisk earnings per share across 2026, 2027, and 2028 has been revised sharply higher at an accelerating pace, with 2028 estimates now approaching $200 per share, up from near zero twelve months ago.
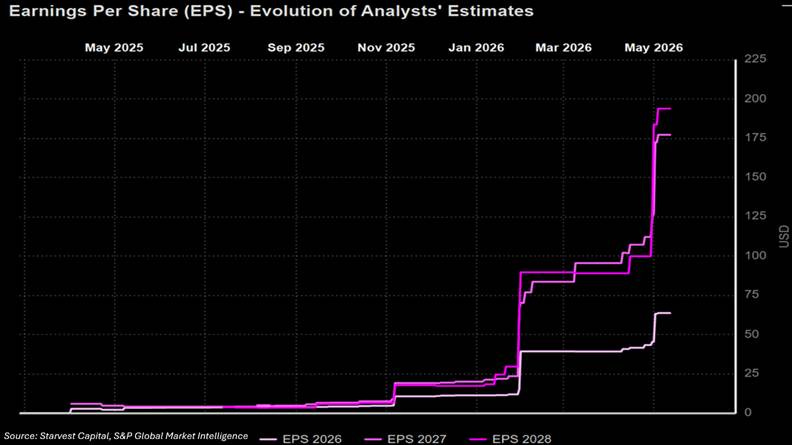
The revision cycle is structural, driven by the acute shortage of high-performance NAND flash memory in AI data centers and the accelerating global restocking of enterprise storage.
The most recent quarterly results, published April 30, make the velocity of that revision cycle concrete: Q3 FY2026 revenue came in at $5.95b, up 251% year on year, beating consensus by $1.2b. You read that correctly. The entire analytical community, with all its models and channel checks and earnings calls, missed the quarter by $1.2 billion. The market has not yet fully processed what that means for the next four. And earnings per share of $23.41 landed 61% above analyst expectations.
Q4 guidance points to revenue of $7.75b to $8.25b against a consensus of $6.49b, with earnings per share of $30 to $33 against an estimate of $22.70.
When earnings estimates accelerate at a velocity that has repeatedly left forecasting models behind, a thirty-fold price increase is the rational response of a market repricing a business, not the irrational exuberance of a bubble.
The same dynamic holds for NVIDIA Corporation, the central villain in Burry’s narrative.
Despite a stock that has become the symbol of the AI trade, NVIDIA currently prices at 26 times 12-month forward earnings, a multiple near its lowest level in a decade.
Analysts covering the GPU market see no meaningful deceleration in the core compute business for the foreseeable future, with data center order visibility extending well into 2027.
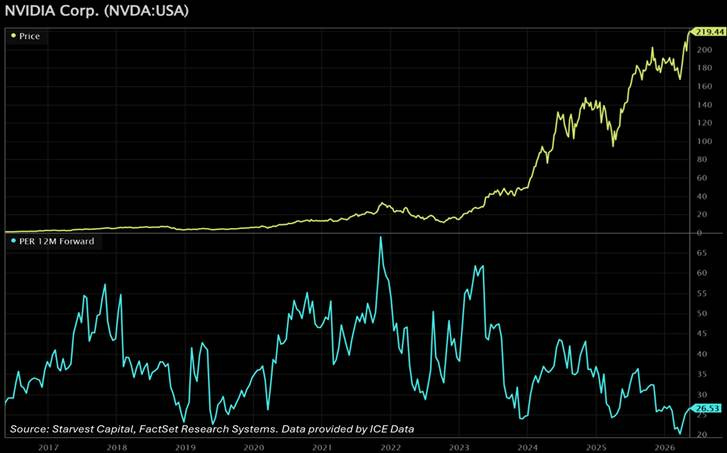
In March 2000, the most celebrated technology companies traded north of 100 times earnings they had yet to generate many years forward, on revenue models that existed only in venture pitch decks.
The analogy Burry is reaching for fails at first contact with the income statement.
II. $805 BILLION IN CONTRACTUAL CAPITAL
The more sophisticated version of the bear case concedes the current earnings picture but argues that Wall Street is systematically overestimating future earnings by as much as 50%.
That is a serious claim. It also happens to be directly contradicted by the private order books of four of the world’s most rigorously audited corporations.
Morgan Stanley’s most recent research on hyperscaler spending makes this point with unusual directness.
The capital committed by the world’s largest technology companies to AI infrastructure has become, in the firm’s own language, “contractual, deployed in direct response to demand that is already booked and signed.”
This spend carries a purchase order. It is the opposite of speculative build.
Morgan Stanley now projects that the five largest technology spenders, Amazon, Alphabet, Meta, Microsoft, and Oracle, will collectively deploy $805b in capital expenditure in 2026, revised upward from a prior estimate of $765b. For 2027, the revised aggregate stands at $1.1 trillion.
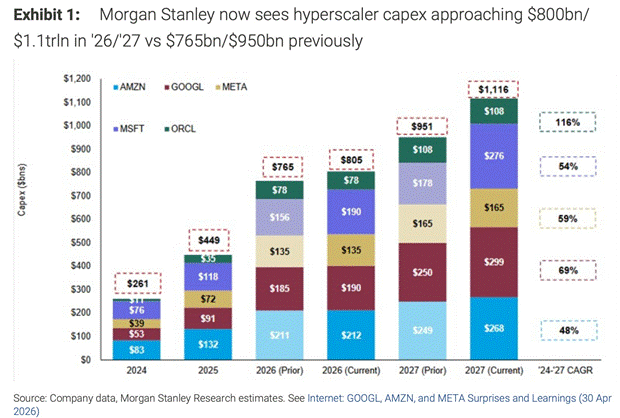
The 2026 year-on-year increase is 77% i.e, nearly equivalent to the entire gross domestic product of Switzerland deployed in a single calendar year.
The executives committing this capital are on the record about why.
Microsoft CFO Amy Hood, January 2026: “Our customer demand continues to exceed our supply.”
Amazon CEO Andy Jassy, Q1 2026 earnings call: capex commitments made with “high confidence” in already-secured customer demand, 6 to 24 months before the first invoice is issued. Amazon’s contracted backlog: $244b, up 40% year on year.
Google‘s equivalent backlog: $240b, with deals exceeding $1b in 2025 surpassing the cumulative total from the previous three years combined.
The premise that Wall Street is overestimating demand by 50% requires investors to disbelieve the signed contracts sitting inside the balance sheets of some of the most closely scrutinized companies in the world.
III. THE SUPPLY CHAIN TELLS A STORY BUBBLES NEVER TELL
Here is the most decisive argument against the dot-com parallel, and the one Burry’s framework most conspicuously omits.
SPECULATIVE BUBBLES GENERATE SURPLUS. STRUCTURAL DEMAND CYCLES GENERATE SHORTAGES.
When the dot-com boom collapsed, the aftermath was a landscape of unused fiber optic cable, empty server farms, and inventory write-downs.
Supply had been built in anticipation of demand that failed to materialize. The consequences were violent and prolonged.
The AI infrastructure cycle is delivering the exact reverse. Across every critical layer of the technology stack, the world’s most credible suppliers are rationing product, extending lead times, and warning of structural scarcity measured in years, not quarters.
Micron Technology. CEO Sanjay Mehrotra stated last week that “aggregate industry supply will remain substantially short of the demand for the foreseeable future.” The structural driver is high-bandwidth memory (HBM), which requires three times the wafer inputs of conventional DRAM per unit shipped.
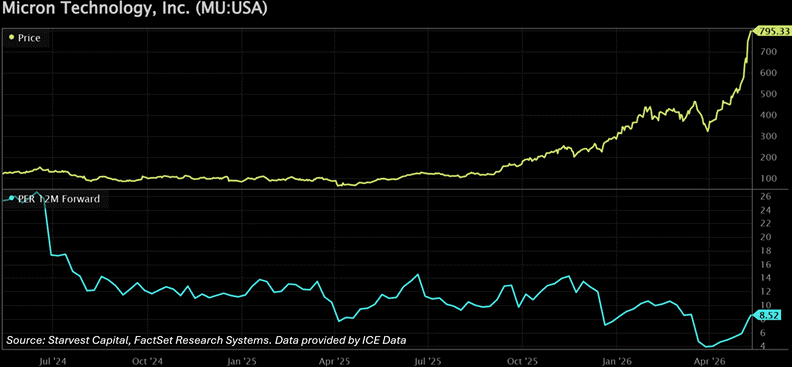
Micron raised its fiscal 2026 capex budget to $20b from $18b to address HBM constraints.
One Micron executive described current conditions as “the most significant disconnect between demand and supply in terms of magnitude as well as time horizon that we have experienced in 25 years in this industry.”
SK Hynix. Chairman Chey Tae-won, speaking at Nvidia’s GTC conference in March 2026: “The current shortage could continue until 2030.” SK Hynix holds a 57% share of the global HBM market. When the dominant supplier of the world’s most critical AI memory component warns of a six-year scarcity window, the bubble narrative collapses on its own logic.
Arista Networks. CEO Jayshree Ullal, Q1 2026 earnings call, quoted verbatim: “Our demand is actually the best I have ever seen in my Arista tenure. We are experiencing industry-wide shortages across the board: wafers, silicon chips, CPUs, optics, and memory. Clearly, our demand is outstripping our supply this year.”
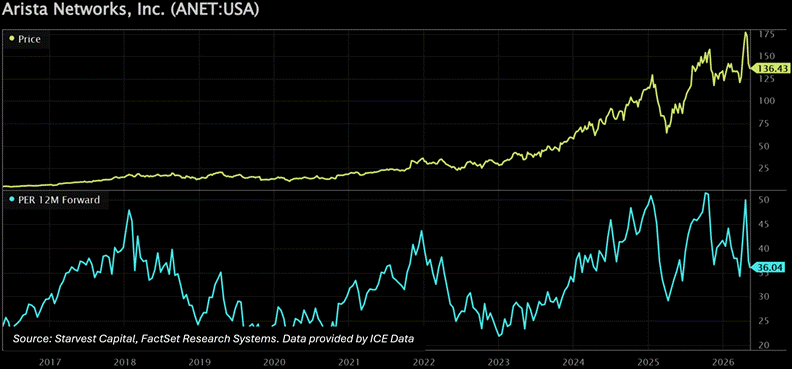
Ullal added that the supply chain problem has evolved into “a one-to-two-year phenomenon.” Arista exited Q1 2026 with $6.2b in deferred revenue, up approximately 100% year on year.
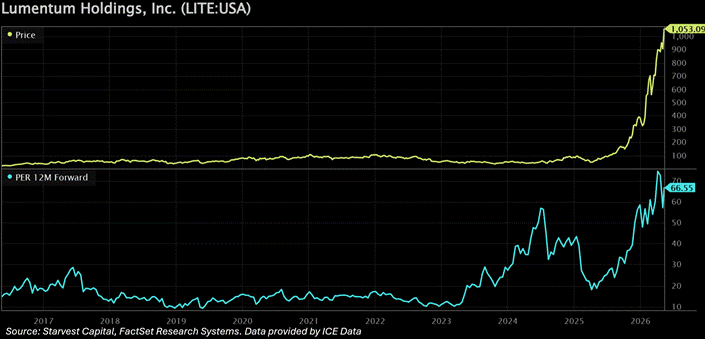
Lumentum Holdings. CEO, early 2026: Lumentum is “completely sold out” through end-2027, backlogs extending into 2028. Running at full capacity, the company is 25% to 30% behind demand, described internally as “way, way under-shipping.” The supply-demand imbalance for EML lasers exceeds 30%, with pump laser constraints running “certainly greater” than that figure. The shortage runs all the way down to the substrate level.
At 67 times 12-month forward earnings, Lumentum is a name in this cycle that trades at a genuine premium to historical standards — the exception that, in context, proves the rule: when a supplier is structurally sold out through 2028, the market is pricing scarcity, not speculation.
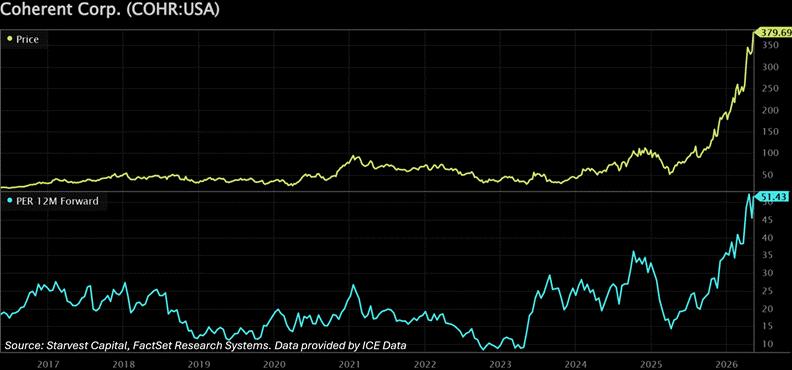
Coherent Corporation, the leading supplier of optical interconnects for AI data centers, closed its most recent quarter with a book-to-bill ratio exceeding 4.0, four times more orders booked than shipped, and locked in a multibillion-dollar supply agreement with Nvidia extending through 2030.
At 51 times 12-month forward earnings, Coherent similarly trades above its historical range — and for the same reason: the market is pricing a multi-year structural supply deficit, not a cyclical rebound.
Shortages are the evidence of genuine demand meeting physical limits. Surplus is the evidence of speculation. The supply chain verdict is unambiguous.
IV. THE REVENUE IS ALREADY IN THE ACCOUNTS
The most emotionally persuasive version of the bear case posits that hyperscalers are building data centers for an AI monetization future that may fail to materialize. That today’s capex represents a leap of faith rather than a response to verifiable demand.
THE MONETIZATION HAS ALREADY BEGUN.
OpenAI is generating $25b in annualized revenue as of early 2026. Anthropic has reached approximately $19b.
These figures represent subscription and API revenues drawn from enterprises and individual users who have made the decision to pay.
Microsoft’s Azure AI services continue to report customer demand exceeding available capacity: a supply problem, not a demand problem.
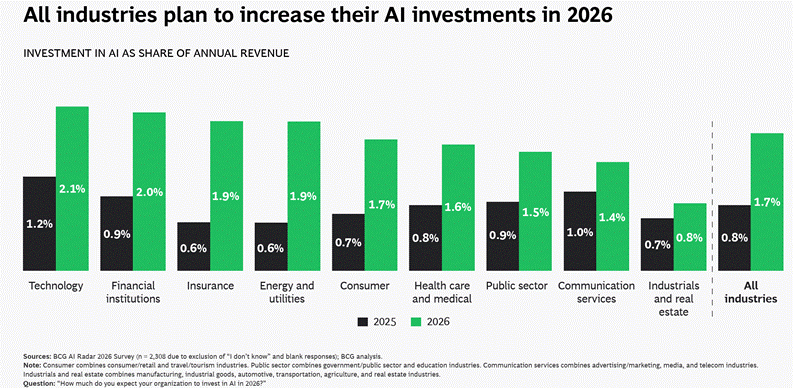
A Boston Consulting Group survey of nearly 2,400 executives found that companies plan to double their AI spending as a share of revenue this year, from 0.8% to 1.7%. More than 90% of chief executives stated their intention to continue investing at current or higher levels.
Dell’Oro Group data frames the aggregate picture precisely.
Data center capital expenditure grew 57% in 2025 to $726b globally, the fastest growth rate the research firm has recorded since it began tracking the statistic in 2014. Dell’Oro now projects that data center capex will cross $1 trillion in 2026, a milestone originally forecast for 2029. The acceleration of that milestone by three years is the quantified expression of demand arriving faster than anyone anticipated.
The semiconductor sector collectively generates $525b in consensus 2026E free cash flow, real income earned from real products sold to real customers.
In 1999, the most celebrated Nasdaq companies were burning cash to acquire eyeballs. Today, the companies enabling AI infrastructure are generating cash at a scale the dot-com generation could not have imagined.
V. THE STRUCTURAL DIFFERENCE A CHART CANNOT CAPTURE
The final and most important distinction between 2000 and 2026 is architectural, not statistical.
The dot-com infrastructure boom was a one-time build. Fiber was laid once. Server farms were built for a world of static web pages. When the demand failed to arrive at the scale anticipated, the infrastructure sat idle for a decade.
Cisco’s revenue in 2001 was $22b. It took the company five years to return to that figure.
Every generation of AI model requires exponentially more compute than the previous one.
Every enterprise deploying AI at scale creates recurring demand for inference infrastructure that compounds with adoption.
The hyperscalers are building for a demand curve that is accelerating, contracted, and increasingly inelastic as enterprise workflows become dependent on AI services.
This is why Andy Jassy describes commitments made 6 to 24 months in advance with “high confidence”: the customers have already signed.
PAUL TUDOR JONES, WHO HAS ALSO DRAWN THE HISTORICAL PARALLEL, ESTIMATES THE BULL MARKET COULD PERSIST FOR ONE TO TWO MORE YEARS.
Even the most historically minded participants in this debate acknowledge that the fundamental demand dynamic remains intact.
Burry is correct that concentration risk is elevated. He is correct that sentiment is stretched. He may be correct that a near-term correction in the most momentum-extended names lies ahead.
Markets always mean-revert at the margin, and the most crowded trades are always the most vulnerable to a catalyst.
His caution on timing, reflected in his reluctance to recommend aggressive short positions, reveals that even he understands the risk of calling the top in a structurally driven cycle.
But the central claim, that AI infrastructure represents a dot-com-style speculative excess built on demand that has yet to be demonstrated, confronts a supply chain rationing product through 2030, corporate buyers sitting on nearly $500b in contracted backlogs, a semiconductor sector generating $525b in free cash flow, and forward earnings multiples that in many cases are compressing, not expanding, even as prices surge.
THE EVIDENCE POINTS TO A STRUCTURAL DEMAND CYCLE. THE RIGHT STOCK PICKING TURNS IT INTO RETURNS.
The Disruptive Investor positioned its subscribers ahead of this capital flow in Q1 2026. Three free picks. Three wins. Average return +57.2%. The latest paid pick carries a +200% price target: thesis, valuation and catalysts available through subscription.
Sources: Morgan Stanley Research (April 2026) · S&P Global Market Intelligence · Micron Technology fiscal Q1 2026 earnings materials · SK Hynix / Nvidia GTC Conference (March 2026) · Arista Networks Q1 2026 earnings call (May 2026) · Lumentum Holdings (March 2026) · Coherent Corporation · Boston Consulting Group (January 2026) · Dell’Oro Group · Amazon Q1 2026 earnings call · Microsoft FY2026 Q1 investor materials.
For informational purposes only. This article does not constitute investment advice. Read the full disclaimer here.